
The monthly Architecture Billings Index (ABI) came in at a score of 53.7 in August, up 1.8 points from July's score of 51.9, the AIA announced today. Though billings eased slightly in July, August's 1.8 gain was expected following July's uptick in new project inquiries.
The ABI is a leading economic indicator of construction activity in the U.S., and reflects a nine- to 12-month lead time between architecture billings and construction spending nationally, and regionally, as well as by project type. A score above 50, as seen every month since February, represents an increase in billings from the previous month, while a score below 50 represents a contraction.

August's positive reading marks the seventh consecutive month of growth in design services since January's marginal decline. The 1.8-point increase in billings was largely anticipated following July's uptick in new project inquiries, which are considered to be the most reliable indicator of future billings. The new project inquiries index continued to climb in August with a score of 62.5, a 3-point increase from July's reading of 59.5. August's strong reading indicates that billings will likely increase again in September.
“The August results continue a string of very positive readings from the design professions, pointing to future healthy growth across the major construction sectors, as well as across the major regions of the country,” said AIA chief economist Kermit Baker, Hon. AIA, in a press release. "And the future rebuilding from hurricanes Harvey and Irma will produce even more construction and rehabilitation activity as these recovery efforts get underway over the coming months and years.”

Design contracts dipped 2.2 points from July's score of 56.4, to a score of 54.2 in August. This drop is not a cause for concern as both inquiries and design contracts have stayed above the 50-point threshold every month in 2017—a sign that momentum is strong in the market despite month-to-month fluctuations in pace.

Regional billings, which, unlike the national score, are calculated as a three-month moving average, increased in two of four regions in August with all regions reporting scores above 50, indicating an increase in design services. The South and the West posted modest increases in billings month-to-month with 0.5- and 0.1-point gains, respectively. Design activity continued to pick up in the Northeast with a score of 54.3, a scant 0.6-point dip from July's score of 54.9. Continued growth in the Northeast is promising, as it was the only region to see billings fall below the 50-point threshold in April and May, and has lagged behind the South and Midwest region consistently in 2017. The Midwest posted a healthy score of 52.5 in August, a 0.5-point dip from July's score of 53.0. The month-to-month decrease in billings seen in the Northeast and Midwest does not indicate contraction, but rather a slower pace of activity compared to a month prior.
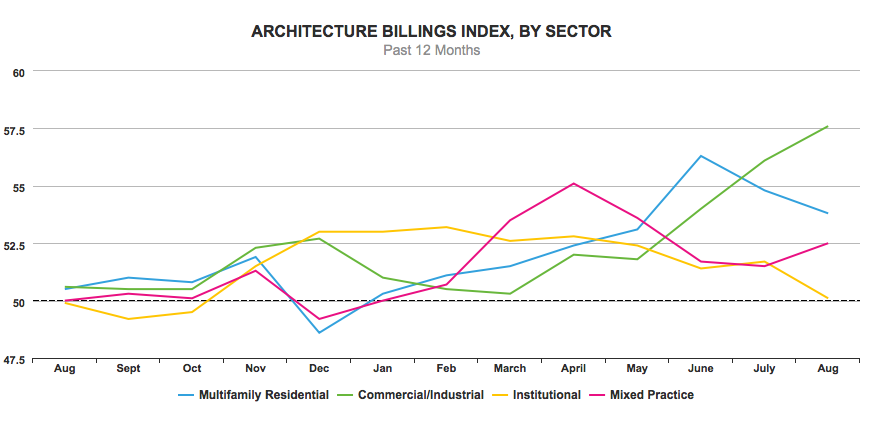
Design activity across all four building sectors posted scores above 50 in August, marking the seventh consecutive month of growth. The commercial/industrial sector experienced the most activity in August with a score of 57.6, a 1.5 point increase from July's score of 56.1. The mixed use sector also posted gains in August, with a 1-point increase to 52.5 from July's reading of 51.5. The pace of design activity in the residential sector slowed for the third consecutive month, but remained healthy in August with a score of 53.8, a 1.0-point decline from 54.8 a month prior. Activity in the institutional sector dipped 1.6 points to a score of 50.1, but still indicates growing demand for design services. (Results of sectors are also calculated as a three-month moving average.)