

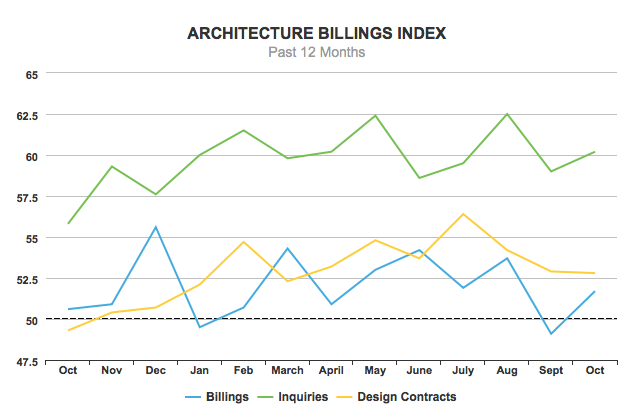
The monthly Architecture Billings Index (ABI) came in at a score of 51.7 in October, up 2.6 points from September's score of 49.1, the AIA announced Wednesday.
The ABI is a leading economic indicator of construction activity in the U.S., and reflects a nine- to 12-month lead time between architecture billings and construction spending nationally, and regionally, as well as by project type. A score above 50, as seen this month, represents an increase in billings from the previous month, while a score below 50, as seen in October, represents a contraction.

Demand for design services picked up in October, with national billings reaching a score of 51.7. This reading puts the index back in positive territory after September's disappointing score of 49.1, which marked the end of seven consecutive months of growth in design services. New project inquiries—considered to be the most reliable indicator of future billings—increased 1.2-points in October to a score of 60.2, indicating that billings will likely stay at a healthy level in November.
“As we enter the fourth quarter, there is enough design activity occurring that construction conditions should remain healthy moving through 2018,” said AIA chief economist Kermit Baker, Hon. AIA, in a press release. “Extended strength in inquiries and new design contracts, along with balanced growth across the major building sectors signals further gains throughout the construction industry.”
Design contracts remained relatively unchanged in October with a score of 52.8—a 0.1 point decrease from September's score of 52.9. This small drop is not a cause for concern as both inquiries and design contracts have stayed above the 50-point threshold every month in 2017—a sign that momentum is strong in the market despite month-to-month fluctuations in pace.

Regional billings, which, unlike the national score, are calculated as a three-month moving average, decreased in all four regions in October, with two regions reporting scores below 50, indicating an decrease in design services. Design activity has decreased the past two months in the Midwest, with a slight 0.8-point dip in October from September's score of 49.8, to a score of 49.0. The West also saw a slight decrease in design services in October, posting a score of 49.8. Design activity increased in the Northeast (54.0) and South (50.8) regions of the U.S. during October, despite posting scores 1.1- and 2.4- points lower month-over-month, respectively. The month-over-month decrease in billings seen in the Northeast and South does not indicate contraction, but rather a slower pace of activity compared to a month prior.

Design activity across all four building sectors posted scores above 50 in September, marking the ninth consecutive month of growth. The commercial/industrial sector experienced the most activity in October with a score of 51.2, although October's score is 2.0 points lower than September's score of 51.4. The mixed use sector (50.7) and institutional sector (50.7) also posted scores 2.3- and 0.2-points lower than reported a month prior, but remained healthy with scores above 50. The pace of design activity in the residential sector slowed for the fourth consecutive month, but also remained healthy in October with a score of 50.7—a 0.7-point decline from 51.4 a month prior. (Results of sectors are also calculated as a three-month moving average.)